Lab 3
Lab 3: Computer Vision For Robotics
Part 1: April Tag Detector
About implementing the april tag detector
For this part of the exercise, we heavily use OpenCV and the apriltag library since the task is to process the image and detect the apriltags.
Here is a breakdown of the code which explains what we did in order to build an apriltag detector:
First we need to initialize the node, and define a subscriber to the camera image topic, a publisher to publish the modified image with detected apriltags on it to a new topic, and an apriltag detector. We also need to define the service which was provided for us, for changing the LED colors based on the detection.
self.sub_image = rospy.Subscriber('/csc22938/camera_node/image/compressed', CompressedImage, self.callback)
self.image_pub = rospy.Publisher("/csc22938/camera_node/april_tags/compressed",
CompressedImage)
self.detector = apriltag.Detector()
self.braodcaster = TransformBroadcaster()
rospy.wait_for_service("/csc22938/led_emitter_node/set_pattern")
self.changePattern = rospy.ServiceProxy("/csc22938/led_emitter_node/set_pattern", ChangePattern)
Then we do the main task In the subscriber callback function:
First, we preprocess the image using OpenCV, to prepare the image for giving it as an input to the apriltag detector:
np_arr = np.frombuffer(data.data, np.uint8)
img = cv2.imdecode(np_arr, 1)
img = cv2.cvtColor(img, cv2.COLOR_BGR2GRAY)
Then we call the detector on the image. The output of this method is a list of detections, each of which indicates a detected apriltag. We can find the position of each apriltag and draw a rectangle around it and indicate its label by iterating through these detections and using detection attributes( corner, and center):
result = self.detector.detect(img)
for r in result:
c1 = [int(x - 10) for x in r.corners[0]]
c2 = [int(x + 10) for x in r.corners[2]]
area = abs(c1[0]-c2[0])*abs(c1[1]-c2[1])
if(area > max_area):
max_area = area
max_area_id = int(r.tag_id)
cv2.rectangle(img, tuple(c1), tuple(c2), 255, 6)
center = tuple([int(x) for x in r.center])
img = cv2.putText(img, str(r.tag_id), center, cv2.FONT_HERSHEY_SIMPLEX, 1, 255, 2, cv2.LINE_AA)
Questions
What does the april tag library return to you for determining its position?
When we call apriltag.detector.detect(), it will return a list of detection objects.
Each of these objects has attributes that contain information about the detected tag.
These attributes include tag_id, tag_family, corners, centers, etc. A detailed list of the attributes and their explanation is provided below (based on GitHub - duckietown/lib-dt-apriltags: Python bindings to the Apriltags library)
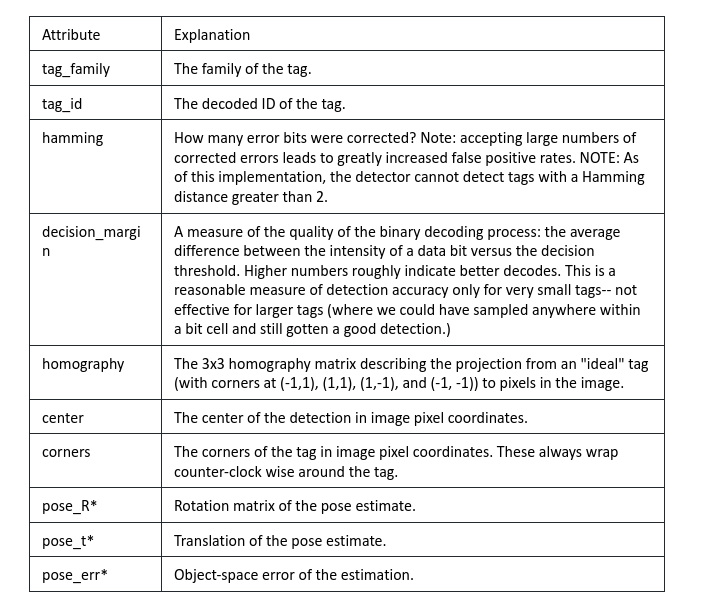
Table 1: Apriltag detection attributes
In particular, we use center, and corners for determining the tag’s position as shown in the previous provided code block.
Which directions do the X, Y, Z values of your detection increase / decrease?
The z value represents the distance from the camera to the tag, and increases as the tag gets further. The x value increase as you move right, and the y value increases as you move down the image.
What frame orientation does the april tag use?
The AprilTag library uses a camera-centric frame orientation, where the X axis points to the right, the Y axis points down, and the Z axis points away from the camera.
Why are detections from far away prone to error?
As the distance between the robot and the apriltags increases, the tag becomes smaller, and the resolution drops. Smaller items from afar are more prone to blur and distortion. This makes it challenging for the apriltag detector to identify the tag which is farther than usual and accurately determine its position.
Why may you want to limit the rate of detections?
Limiting the rate of detection can prevent data overload for the detector. This will ensure that the node has enough time to process the images and make detections.
Therefore, choosing the right rate for detections can help reduce false detections and improve our detector system.
We control the detection rate in this chunk of the code:
self.time = (self.time + 1)%1000
if(self.time % 10 == 0):
#process the date
Deliverable 1
Record a video of your apriltag detector image topic detecting an apriltag and labeling the apriltag.
Here are the april tag detection results, showing that the robot can detect april tags, and change its LED light based on the detection:
Part 2: PID Controller
About implementing the PID controller
For explaining the PID controller theory details, we are heavily referencing the edX course on self-driving cars with duckietown.
PID controller is a feedback-based method of control that generates the output(in our case, the command signal to the duckiebot wheels) based on the error.
Error is calculated as the difference between the measured output, and the reference.
Then, the controller input is a combination of the error proportion, integral of the error, and derivative of the error. Details are shown in the figure.
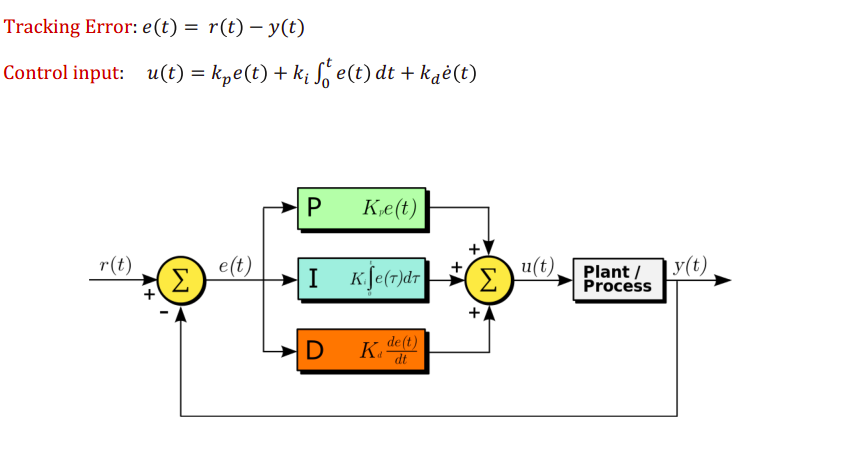
Figure 1: PID controller
In our case and for the lane following task, the error is the drift of the robot from the middle of the road, calculated based on the camera information. (details are explained in the next section.) The control input is a proportion of error added by its integral and derivative. (Since it’s not a super hard task, the P part is fairly enough.) And the control output is the wheel commands ( In our code, setting the velocity and omega.)
We define a publisher and send the control commands with this function on the joy_mapper_node/car_cmd topic.
def control_wheels(self):
cmd_msg = Twist2DStamped()
cmd_msg.header.stamp = rospy.Time.now()
cmd_msg.v = self.target_v
cmd_msg.omega = self.target_omega
self.pub_cmd.publish(cmd_msg)
The following lines provide a brief explanation of how different parts of the PID work.
In a PID controller, kp indicates the coefficient for the P part.
Larger kp values can cause faster response and smaller errors in steady state, but at the same time, too large values can cause larger oscillations and overshoot. Figure 2 shows the effect of different values for kp:
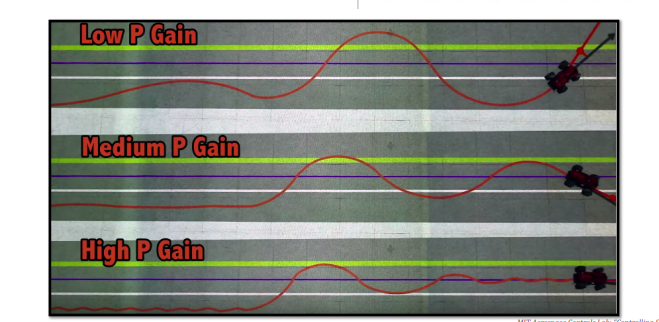
Figure 2: Effect of different values of kp
Ki is the coefficient for the I part of the PID controller. Increasing its value can help the robot take into account the history of the error. It eliminates the steady state error, and lowers the overshoot but can cause slower responses and noise sensitivity.
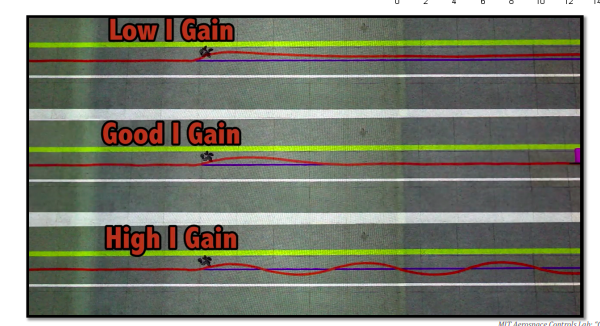
Figure 3: Effect of different values of ki
Kd is the coefficient for the D part of the PID controller. Increasing it helps the robot be able to anticipate what the error will be in the next step. It reduces overshoot and causes a faster response, but is not a good idea when the measurements are noisy.
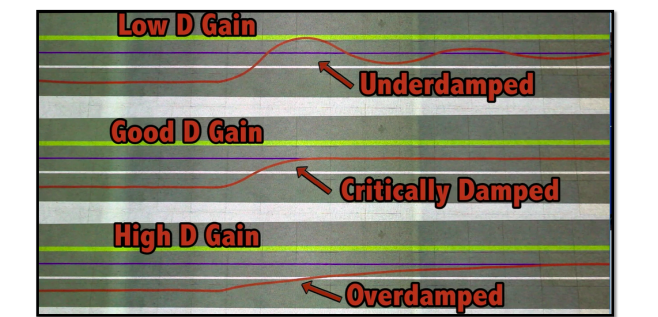
Figure 4: Effect of different values of kd
There are some proposed technical ways to find the best ki, kp, and kd, but for our case, we use trial and error to find the best coefficient.
Questions
What is the error for your PID controller?
Short answer: deviation of the robot from the yellow line in the middle of the lane.
Long Answer:
The goal of the controller is to keep the robot such that it follows the yellow line and stays in the middle of the black lane. (in the English driver style, it should be on the left side of the road. However, the logic is the same with some minor changes.)
By knowing that the robot has deviated to the right or left, we can get feedback on how the robot is performing, and adjust the control commands accordingly.
In the code, the calculate_error() function calculates the error for the controller.
The error is calculated based on the position of the yellow line in the image.
We will explain in detail how this function works:
First, we resize the image to 16*16:
img = cv2.resize(img, (16, 16))
Then, we convert the input image from default RGB color to the HSV space (Hue, Saturation, Value) using this line:
img_hsv = hsv = cv2.cvtColor(img, cv2.COLOR_BGR2HSV)
This will separate the color information from the brightness information and will help us process the image colors easier.
We indicate the range of the color yellow:
range_color = [23, 28]
Then we mask other colors so that we only have information about the color yellow. We also only analyze the hue of the image:
img_hsv = img_hsv[:, :, 0] * (img_hsv[:, :, 0] > range_color[0]) * (img_hsv[:, :, 0] < range_color[1])
Then we calculate the percentage of yellow in the right and left side of the road, and therefore can determine if the yellow line is in the middle, right, or left side of the road:
sum_val = np.sum(img_hsv, axis=0) / np.sum(img_hsv)
first_eight = np.sum(sum_val[0:8])
last_eight = np.sum(sum_val[8:16])
error = first_eight - last_eight
If the error is positive, it means that the yellow line is farther to the right than the center of the image. If the error is negative, it means that the yellow line is farther to the left than the center of the image. The robot then adjusts its motion based on the value of the error, with the goal of keeping the yellow line centered in the image as much as possible.
The following block chooses the control output(wheel command) based on the error:
error = self.calculate_error(img)
if(abs(error) < 0.4):
self.target_v = UP[0]
self.target_omega = UP[1]
elif(error > 0):
self.target_v = LEFT[0]
self.target_omega = LEFT[1]
elif(error < 0):
self.target_v = RIGHT[0]
self.target_omega = RIGHT[1]
● If your proportional controller did not work well alone, what could have caused this?
In our case, by tuning the controller, we could have good results even just with the P part of the controller. However, the below reasons can cause the proportional controller not to work well alone:
1- very high or very low kp value
2- Proportional controller is not enough if there are nonlinearities or complexities in the system.
For instance, if there are bumps in the road for the duckiebot.
● Does the D term help your controller logic? Why or why not?
In theory, the D term can help the robot be able to anticipate what the error will be in the next step. It can help with reducing overshoot if the controller is tuned well enough.
● (Optional) Why or why not was the I term useful for your robot?
In theory, this part can help the controller take into account the history of the error. It however, can cause lower response.
Deliverable 2
Record a video of your bot lane following using the PID controller.
Part 3: Localization using Sensor Fusion
In this part of the lab, we worked heavily with the transformations to do the localization.
Transformations are used to represent the position and orientation of objects relative to each other in a robot system. These transformations allow for seamless coordination between various robot components and sensors, and enable accurate navigation and manipulation in complex environments.
In summary, in different parts of this exercise, we define and send transforms, to indicate the robot frame, world frame, april tag positions, and detections. Then we visualize the frames and the results in Rviz.
Part 3.1: Odometry Frame
We can send the odometry frame information with relation to the world frame as the parent, to visualize the robot moving around in the world.
In order to send the transrom, we first need to define a TransformStamped object, and then indicate its different attributes. Here, odometry is the child, and world is the parent.
Translation is the component of a transform that describes the position of an object in three-dimensional space, typically expressed as a vector (x, y, z) indicating the position in the x, y, and z directions. In this case, translation is the robot’s position which is calculated using odometry and kinematics in the deadreckoning package.
We also need to indicate another component of the transformation: rotation.
The rotation component of a transform describes how an object is rotated or oriented in three-dimensional space relative to a reference coordinate frame. In a transform, the rotation component can be represented using various methods such as Euler angles, rotation matrices, or quaternions. By specifying the rotation component of a transform, one can determine how an object is oriented in space and how it should be transformed to align with another object or coordinate frame.
We found out that the easier way to define orientation, is to use euler angles.
Euler angles are a set of three angles (denoted as roll, pitch, and yaw) that represent the rotation around each of the three axes in a fixed order.
We then convert euler angles to quaternions( a four-dimensional vector to indicate rotations) using a tf library built-in function and pass it to the constructor of the transform object.
Then we can send the transformation using a broadcaster as shown here:
#Part 3.1
t = TransformStamped()
t.header = odom.header
t.header.stamp = rospy.Time.now()
t.child_frame_id = "odometry"
t.header.frame_id = "world"
t.transform = Transform(
translation=Vector3(self.x, self.y, self.z), rotation=Quaternion(*self.q))
self._tf_broadcaster.sendTransform(t)
Observations and Deliverables: We find out that as we circle the robot multiple times, the errors accumulate, and the odometry frame shown in rviz tends to drift from the robot’s real position in the world. The reason, as mentioned, is the errors caused by the imperfections of the real world in calculating the odometry, and accumulating all these errors over time.
Part 3.2: Creating Static Landmark Frames
We can define the static frames for the apriltags using static transform broadcasters in static_transform_broadcaster.py file in our project.
Again, the parent frame is the world, and the child frame is the apriltag. We calculate the rotation based on how the robot is oriented in x,y and z axis with respect to the world frame( using the right hand rule), and then convert these euler angles to the quaternions.
We put sleep to make sure all the transformations are sent.
#!/usr/bin/env python3
import rospy
import tf
from geometry_msgs.msg import TransformStamped
from tf2_ros.static_transform_broadcaster import StaticTransformBroadcaster
# two almost similar sources I reference for this code:
# https://docs.ros.org/en/rolling/Tutorials/Intermediate/Tf2/Writing-A-Tf2-Static-Broadcaster-Py.html
# http://wiki.ros.org/tf2/Tutorials/Writing%20a%20tf2%20static%20broadcaster%20%28Python%29
PI = 3.1415
apriltag_list = [200, 201, 94, 93, 153, 133, 58, 62, 169, 162]
apriltag_name_list = ['200', '201', '94', '93',
'153', '133', '58', '62', '169', '162']
x_list = [0.17, 1.65, 1.65, 0.17, 1.75, 1.253, 0.574, 0.075, 0.574, 1.253]
y_list = [0.17, 0.17, 2.84, 2.84, 1.252, 1.755, 1.259, 1.755, 1.755, 1.253]
yaw = [PI/2 + PI/4, PI/2 + 3*PI/4, -PI/4, PI/2 - PI/4, 0, PI, 0, PI, PI/2, -PI/2 ]
pitch = [1.57]
if __name__ == '__main__':
rospy.init_node('my_static_tf2_broadcaster')
broadcaster = StaticTransformBroadcaster()
i = 0
for i_april in apriltag_list:
t = TransformStamped()
t.header.stamp = rospy.Time.now()
t.header.frame_id = 'world'
t.child_frame_id = apriltag_name_list[i]
t.transform.translation.x = float(x_list[i])
t.transform.translation.y = float(y_list[i])
t.transform.translation.z = float(0)
quat = tf.transformations.quaternion_from_euler( float(-PI/2), float(0), yaw[i])
t.transform.rotation.x = quat[0]
t.transform.rotation.y = quat[1]
t.transform.rotation.z = quat[2]
t.transform.rotation.w = quat[3]
broadcaster.sendTransform(t)
# self.log(f"sent info for apriltag {apriltag_name_list[i]}")
rospy.sleep(0.2)
i+=1
# rospy.spin()
We also define a service for teleportation. Here is the function that can update the robot’s position. ODO and ODOResponse are srv defined in the costum_msgs package, which are used as service descriptions for enabling this service:
def Teleport(self, msg):
odom = Odometry()
self.x = msg.x
self.y = msg.y
self.z = msg.z
odom.header.stamp = rospy.Time.now() # Ideally, should be encoder time
odom.header.frame_id = self.origin_frame
self.yaw = msg.orientation
self.q = tr.quaternion_from_euler(0, 0, msg.orientation)
odom.pose.pose = Pose(Point(msg.x, msg.y, msg.z), Quaternion(*self.q))
odom.child_frame_id = self.target_frame
odom.twist.twist = Twist(Vector3(self.tv, 0.0, 0.0), Vector3(0.0, 0.0, self.rv))
self.pub.publish(odom)
return ODOResponse()
We can call the service by indicating the robot’s new position(x, y and z) and orientation in the z axis(yaw) as the parameters.
$rosservice call /csc22938/deadreckoning_node/teleport 0.0 0.0 0.0 0.0
Questions
Where did your odometry seem to drift the most? Why would that be?
In the corners when the robot makes a turn, it seems that the odometry drifts the most.
The reason is that Kinematics formulas used to update the odometry are derived based on some assumptions which might not be true in the real world Wheels are assumed to be identical which might not be the case. It is also assumed that there is no slipping and skidding. Rigid body rotation is another assumption, that might be violated in the real world. These reasons can cause the actual and the desired location to be different. For instance, when the robot turns, it might slip, or if the robot moves fast, it might skid.
Also, as the time passed, wes saw that the odometry drifted even more. The reason is that in deadreckoning updates the robot estimated position based on previous estimates, which results in the accumulation of errors.
Did adding the landmarks make it easier to understand where and when the odometry drifted?
Yes, adding the landmarks made it easier to understand where and when the odometry drifted. By creating static frames for the apriltags and using them as landmarks, we could compare the robot’s perceived odometry with the location of the known landmarks. This way, we can update the robot position based on these known locations in case of drift and errors, and make our localization more accurate in case of drifting. In general, the landmarks provide a reference frame that the robot can use to correct for any errors in the odometry estimate, and improve localization.
Deliverable 3
Record a video on your computer showing RViz: displaying your camera feed, odometry frame and static apriltag frames as it completes one circle. You can drive using manual control or lane following.
Part 3.3: Creating a Transform Tree Graph
As mentioned in the exercise, there are different ways to create the transform.
For instance by following these commands, we can get the transform tree graph as a pdf:
$sudo apt update sudo apt install ros-noetic-tf2-tools.
$rosrun tf2_tools view_frames.pye
$evince frames.pdf
The resulting graph is a graphical representation of the coordinate frame hierarchy in our robot environment. It can be useful when transforming coordinates between different frames.
This means that if we know the relationship between different frames in a tree, we can simply move between them using mathematical operations.
This becomes important when doing localization, or when we want to work with sensor data from different parts of the robot. It is also useful to know the transform graph iin a multi-robot environments so that robots can have an estimate of each other’s location, and cooperate.
What is the root/parent frame?
Based on the tree, the root is “${veh}/footprint”
Deliverable 4
Attach the generated transform tree graph, what is the root/parent frame?
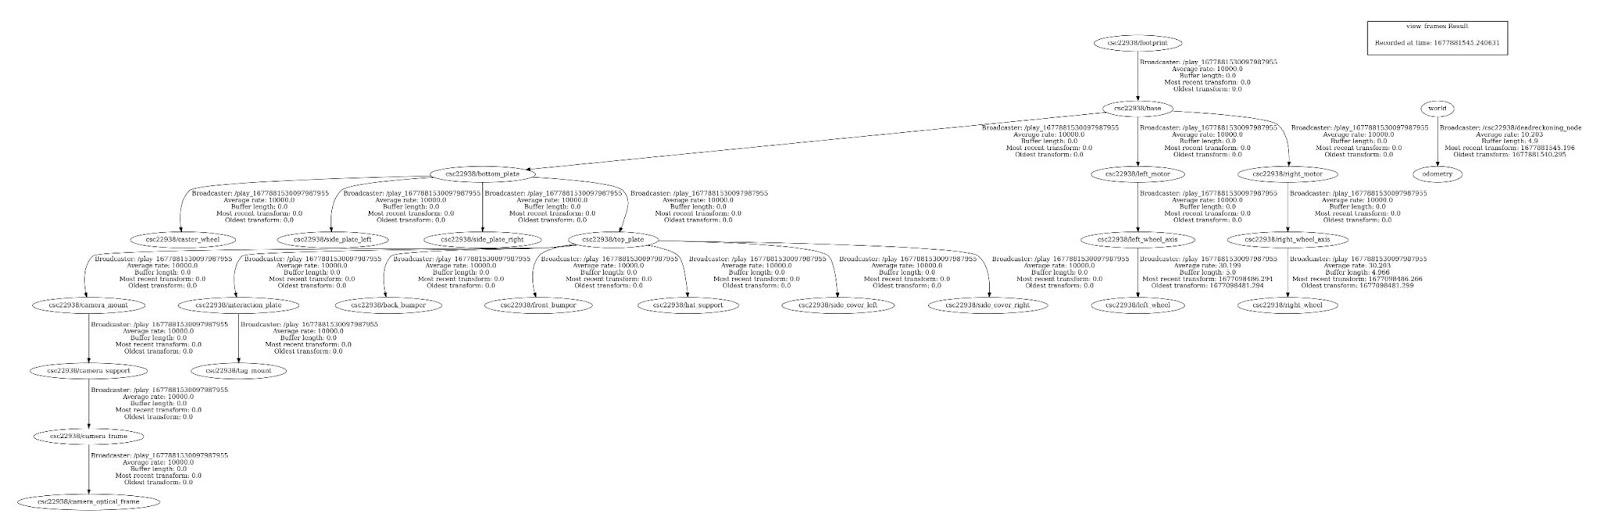
Figure 5: transform graph
Part 3.4: Visualizing the Robot Transforms
Move the wheels and make note of which joint is moving, what type of joint is this?
Based on the duckiebot URDF, the information for the right and left wheel is provided here:
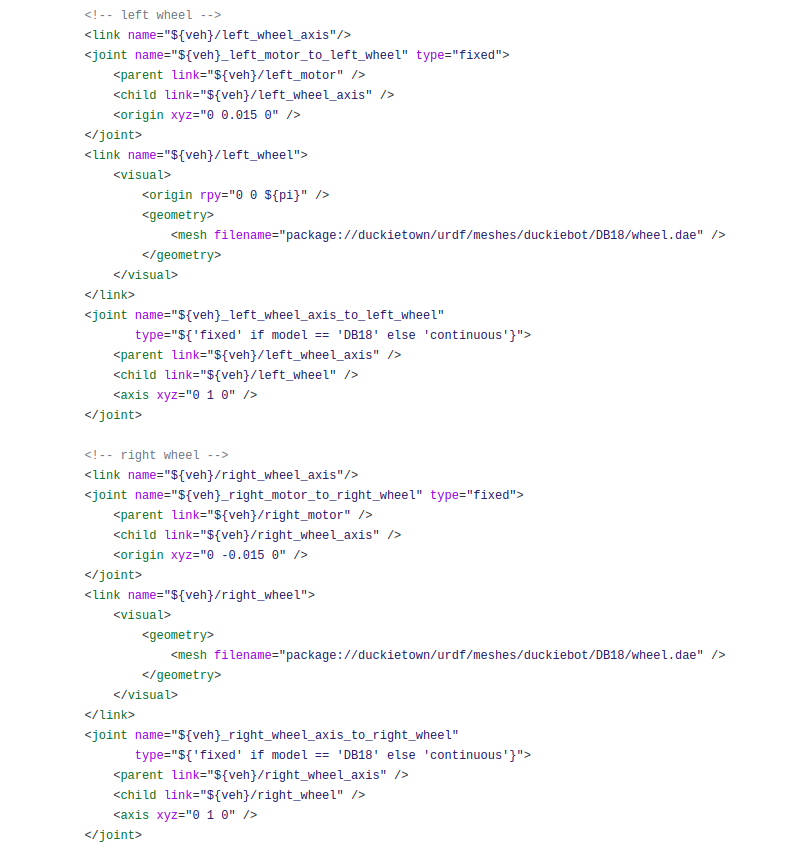
Figure 6: part of duckiebot URDF
The left_motor_to_left_wheel and right_motor_to_right_wheel are fixed joints. The joints from the wheel to the axis are continuous: Left_wheel axis_to_left_wheel and right_wheel_axis_to_right_wheel are continuous.
Part 3.5: Connecting the Odometry Frame to the Robot Frame
You may notice that the wheel frames rotate when you rotate the wheels, but the frames never move from the origin? Even if you launch your odometry node the duckiebot’s frames do not move. Why is that?
The reason why the wheel frames rotate when we rotate the wheels, but the frames never move from the origin is because the wheel frames are attached to the robot frames, and the robot frame is not connected to the world and the odometry frame yet, so they move relative to the robot frame(which causes not moving, only rotating), not relative to the world. We need to attach the odometry frame as the parent, to the robot root frame(which is footprint) to track the robot moving in the world, with all its frames.
What should the translation and rotation be from the odometry child to robot parent frame? In what situation would you have to use something different?
They all should be zero because the robot should have the exact coordinates as the odometry, and they do not have any difference relatively.
If the odometry sensors and processes where done remotely, we might need to use something different.
#part 3.5
broadcaster = StaticTransformBroadcaster()
st = TransformStamped()
st.header.stamp = rospy.Time.now()
st.header.frame_id ='odometry'
st.child_frame_id = 'csc22938/footprint'
q = tr.quaternion_from_euler(0, 0, 0)
st.transform = Transform( #footprint and odometry should be the same in translation and rotation
translation=Vector3(0, 0, 0), rotation=Quaternion(*q))
broadcaster.sendTransform(st)
###################################################################
After creating this link generate a new transform tree graph. What is the new root/parent frame for your environment?
The root frame is now the world, since it is the parent frame for the odometry and odometry is now the parent frame for footprint which was the top-level frame in the graph before this change.
Can a frame have two parents? What is your reasoning for this?
Based on the tf documentation, tf expects the frames to form a tree. This means that each frame can only have one parent. Our reasoning is that this limitation allows for nice closed form solutions for tree traversal and moving from one frame to another. Otherwise it would be really hard or impractical to move from one frame to another.
Having multiple parents can introduce other challenges. For example, if a node has two parents, and the two parents have the same common parent, then how should the position of the node change if only one parent of the node moves?
Can an environment have more than one parent/root frame?
An environment can have multiple root frames if it is composed of disconnected components. When we do not need transforms from certain parts of the robot or an environment together, we can define separate trees for each component.
However, having the world as the only root, seems to be a good practice.
Deliverable 5
Attach your newly generated transform tree graph, what is the new root/parent frame? world
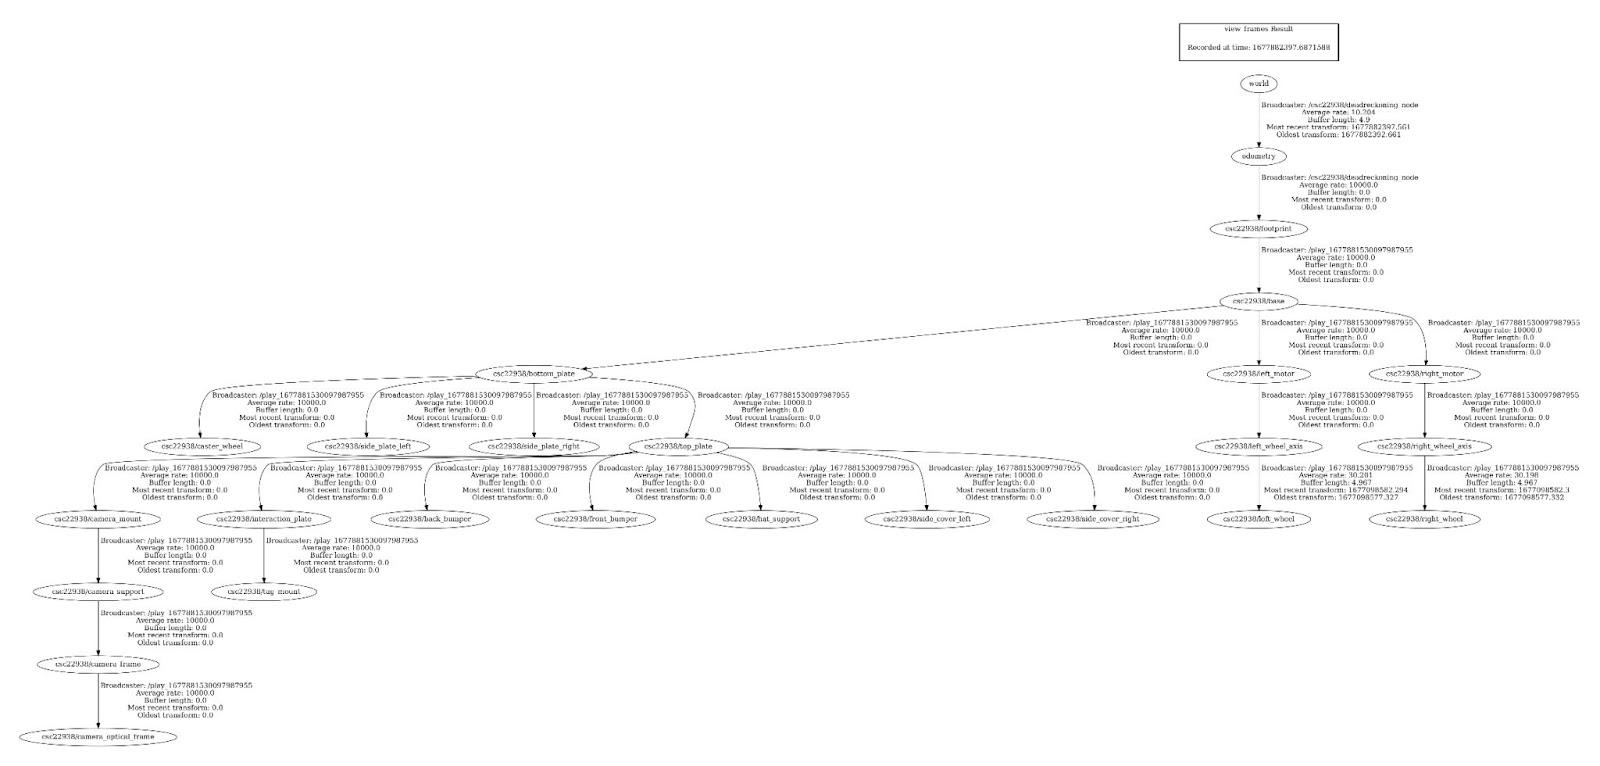
Figure 7: transform graph after the change
Part 3.6: Visualizing Apriltag Detections in Rviz
By adding this code block to the for loop which analyzes the apriltag detection objects, we can send transforms of their locations. Parent frame is the camera_optical_frame” and the transform’s rotation and translation can be found at in pose_R and pose_t attributes of the detection.
# #####################broadcast transform from camera to apriltag###############################
t = TransformStamped()
t.header.stamp = rospy.Time.now()
t.header.frame_id = "camera_optical_frame"
t.child_frame_id = "apriltag_" + str(r.tag_id)
q = _matrix_to_quaternion(r.pose_R)
p = r.pose_t.T[0]
t.transform = Transform(
translation=Vector3(p[0], p[1], p[2]), rotation=Quaternion(x=q[0], y=q[1], z=q[2], w=q[3]))
self.broadcaster.sendTransform(t)
###################################################################################################
Deliverable 6
Record a short video of your robot moving around the world frame with all the robot frames / URDF attached to your moving odometry frame. Show the apriltag detections topic in your camera feed and visualize the apriltag detections frames in rviz.
https://khurramjaved.com/cmput503video6.html
Questions
How far off are your detections from the static ground truth.
The detections of the AprilTags that are in the center of the image and closeby are accurate. However AprilTags that are detected while taking turns, or those that are further away are, don’t seem to be very accurate.
What are two factors that could cause this error?
Error in pose estimation of the apriltag could cause some error. The error could arise due to inaccuracies in camera calibration, and implementation details of apriltag detection.
Error in the estimate of the position of the robot could introduce some error
Part 3.7: Calculating the Transforms from Apriltag to Robot Base and Applying to Static Frame
Questions
Is this a perfect system?
No, the system is not perfect. The position of the robot is not always correct, and the position often changes abruptly when apriltags are detected and used for teleporting the robot.
What are the causes for some of the errors?
One major source of error is due to the error in the pose estimation of AprilTags. Due to low resolution, imperfect camera calibration, and other implementation details of AprilTag detection library, the estimated pose and location of the detected AprilTag is not exact. When we use the inaccurate information to teleport the bot, the resulting position of the bot is also not accurate. Additionally, the camera does not always detect the apriltag, and the robot has to use the odometry to update the location. We know from initial parts of the lab that odometry estimates are not accurate when taking turns. The location of the robot can become inaccurate, as a result.
What other approaches could you use to improve localization?
One approach would be to increase the number of landmarks. By increasing the number of AprilTags, we can make sure that multiple apriltags are visible in every frame. We can compute the estimated position of the robot from each AprilTag, and take the average of all the predictions. That will likely reduce some error.
Calibrating the camera better would also improve localization, as it will improve the estimate of the position of AprilTags. Finally, we can collect a dataset of ground truth positions, and the camera images and train a machine learning model to predict the ground truth from images. The model would be able to go beyond the AprilTags and use all the information in the images to localize the robot. I suspect that if we collected a large enough dataset, the model would perform very well.
Deliverable 7
Show a short video of your robot moving around the entire world (see image below) using lane following and have your sensor fusion node teleport the robot if an apriltag is found and use odometry if no apriltag is detected. Try to finish as close to your starting point as possible.
https://khurramjaved.com/cmput503video7.html
Breakdown
Khurram did part 1 of the exercise.
Both partners did part 2 and 3 together.
Golnaz wrote the report.
References
AprilTag with Python - PyImageSearch
20201019 - 05 - Control in Duckietown (PID)
tf2/Tutorials/Writing a tf2 static broadcaster (Python) - ROS Wiki
Computing TF transforms with AprilTag · Jethro Kuan
GitHub - duckietown/lib-dt-apriltags: Python bindings to the Apriltags library
(other github resources are cited in the code)